
In this tutorial I will show you how to analyze performance problems and bottlenecks on Windows Server and Windows Client Operating Systems. I mostly use the open source Performance Analysis Tool from Clint Hoffman which is free and available on GitHub.
Performance Analysis of Logs (PAL) Tool
Overview at a glance
1. Collecting Performance Logs
2. Installing and Configuring PAL (Performance Analysis of Logs)
3. PAL (Performance Analysis of Logs) Report
1. Collecting Performance Logs
Performance Logs can be collected over the Performance Monitor Wizard by typing Perfmon in Start Menu > Run > Perfmon or with the command line tool version of Performance Monitor which is logman.exe. Please run the below commands on a privileged cmd window (Run as Administrator) on your affected server or pc.
The below command in the example will collect performance logs from the mentioned performance counters and all objects with and interval of 5 seconds and the performance log will have an max size of 500 MB.
Of course you can change the interval and the max size of 500 MB but I don’t recommend a performance log greater than 500 MB. Most of the Analysis Tools can crash during the analysis and processing with such a huge log. In our example once the 500 MB size is reached it will be overwritten.
Example :
logman.exe

a.) logman.exe create counter Perf-Counter-Log-General -v mmddhhmm -max 500 -c "\LogicalDisk(*)\*" "\Memory\*" "\Network Interface(*)\*" "\Network Adapter(*)\*" "\Paging File(*)\*" "\PhysicalDisk(*)\*" "\Process(*)\*" "\Processor(*)\*" "\Server\*" "\System\*" -si 00:00:05
b.) Logman start Perf-Counter-Log-General (To Start Perfmon)
c.) Logman stop Perf-Counter-Log-General (To Stop Perfmon)
Once you create the Perf-Counter-Log-General template it will be visible in the Performance Monitor UI . You can of course start the template over the UI too.

2. Installing and Configuring PAL (Performance Analysis of Logs)
Once you download and install PAL from GitHub Performance Analysis of Logs (PAL) Tool it will be visible in the Start Menu.
2.1. Please start PAL and type the path to the performance log here.

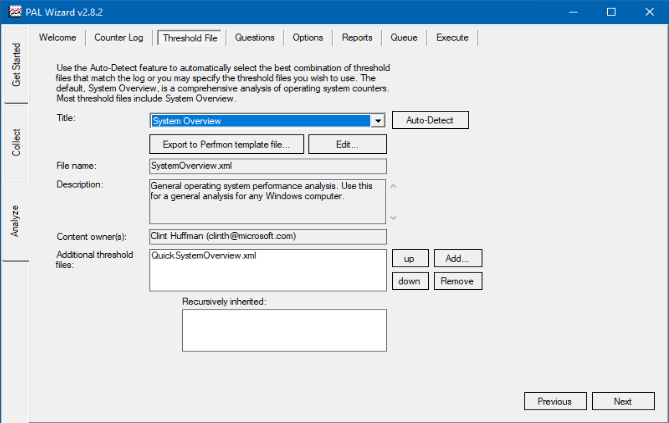
2.2. If you are checking the general performance of the server or pc please select “System Overview” otherwise select the related role of the server.
2.3. Select the appropriate Operating System and enter the amount of your Physical Memory. The accuracy of the amount of the physical memory is very important because the alerts inside the report will be triggered based on this amount. It is used during processing and calculation of the performance logs.

2.4. Please check the option “Process all of the counters in the counter log”.

2.5. Leave everything as it is.

2.6. On the Queue tab please select “Next” and continue.

2.7. At the “Execute” tab I would recommend you to increase the number of processing threads to at least 12 threads if your performance logs is greater than 100 MB otherwise it can really take tenth of minutes till the report gets generated.

2.8. Once you click on finish in the UI a powershell window will pop up and process the performance counters.

3. PAL (Performance Analysis of Logs) Report
Mentioned below a few screenshots from the generated report. All problematic areas will be highlighted in yellow and red with a detailed explanation. Furthermore thresholds for the counters and recommendations are also included inside the report. Now you know where the problem exactly is.
3.1.

3.2.

3.3.

Good luck !